

The unpredictable nature of financial markets stems from the complex interactions of various factors, the influence of human behavior, and the constant evolution of global economic conditions. As a result, accurately predicting market movements consistently is a formidable challenge. Nine major factors contribute to the inherent unpredictability of markets as follows:
1. Information Asymmetry
Participants in financial markets exhibit varying levels of access to information. Some individuals may be privy to insider information, while others rely on publicly available data. The dissemination and processing speed of information differ, creating disparities in how the market reacts to news and events.
Types of Information Asymmetry
- Adverse Selection occurs before a transaction when one party has more information about the quality of a financial product than the other. For example, a seller may have more information about the true value of an asset being sold than the buyer.
- Moral Hazard arises after a transaction when one party has more information about its actions or intentions than the other. For instance, after obtaining insurance, an individual might take on riskier behavior knowing that the consequences may not fully affect them.
Sources of Information Asymmetry
- Insider Trading: Participants with access to confidential, non-public information about a company can gain an advantage over other investors. Trading based on insider information is illegal in many jurisdictions.
- Information Lag: Differences in the speed at which information is disseminated can create imbalances. Some participants may receive information faster than others, leading to disparities in reactions to news or events.
- Research Disparities: Institutions or individuals with greater resources for research and analysis may uncover information not readily available to others, providing them with an informational advantage.
Effects of Information Asymmetry on Financial Markets
- Market Inefficiency: Information asymmetry can lead to market inefficiencies, as prices may not accurately reflect all available information. This inefficiency can create arbitrage opportunities but can also result in misallocation of resources.
- Reduced Investor Confidence: When investors perceive that others may have an informational advantage, it can erode confidence in the fairness and integrity of the market. This can lead to reduced participation and liquidity.
- Regulatory Responses: Regulatory bodies implement measures to address information asymmetry, such as insider trading laws and regulations promoting transparency in financial reporting. These measures aim to level the playing field and enhance market integrity.
Mitigation Strategies Against Information Asymmetry
- Transparency: Increasing transparency in financial markets by requiring companies to disclose relevant information helps reduce information asymmetry. This includes regular financial reporting, earnings releases, and disclosures of material events.
- Regulatory Oversight: Regulatory authorities play a crucial role in monitoring and enforcing rules against illegal practices, such as insider trading. Penalties for violating insider trading regulations serve as a deterrent.
- Investor Education: Educating investors about the risks associated with information asymmetry and the importance of conducting thorough research can empower them to make more informed decisions.
2. Human Behavior
Human behavior is a significant contributing factor to the unpredictability of financial markets. Markets are ultimately driven by the collective actions, decisions, and emotions of individuals participating in buying and selling securities. Understanding the complexities of human behavior in the context of financial markets involves considering several key aspects:
Emotions and Sentiment
- Fear and Greed: Investors often make decisions based on emotions such as fear and greed. During times of uncertainty or market downturns, fear may drive selling, leading to market declines. Conversely, periods of optimism and rising prices can be fueled by greed, contributing to market bubbles.
- Herding Behavior: Many investors tend to follow the crowd, assuming that the collective wisdom of the market is accurate. This herding behavior can lead to exaggerated market movements, as individuals may make investment decisions based on the actions of others rather than independent analysis.
Cognitive Biases
- Overconfidence: Some investors exhibit overconfidence in their abilities, leading them to take excessive risks or ignore warning signs. This bias can contribute to market bubbles and subsequent corrections.
- Loss Aversion: Investors often feel the pain of losses more intensely than the pleasure of gains. This loss aversion can lead to conservative decision-making, reluctance to sell losing positions, or panic selling during market downturns.
- Anchoring: Investors may anchor their decisions to past events or prices, even when conditions have changed. This anchoring bias can lead to delayed reactions to new information and contribute to market inefficiencies.
Behavioral Finance
- Market Anomalies: Behavioral finance explores market anomalies that cannot be explained by traditional economic theories. Phenomena like the January effect (seasonal stock price patterns) or momentum trading (buying securities with recent positive performance) can be attributed to behavioral factors.
- Limited Rationality: Behavioral finance challenges the assumption of perfect rationality in traditional finance models. Investors may not always make optimal decisions due to cognitive limitations, heuristic shortcuts, or emotional influences.
Impact of News and Information
- Noise Trading: Market participants often react to news and information, contributing to short-term market volatility. The interpretation of news can vary widely among investors, leading to divergent reactions and unpredictable market movements.
- Behavioral Biases in Analyst Forecasts: Analysts and investors may exhibit biases in their forecasts and predictions, influenced by over-optimism or overreacting to recent events. These biases can contribute to market inefficiencies.
Market Dynamics
- Feedback Loops: The market’s response to news or events can create feedback loops, amplifying trends or corrections. For example, a sell-off triggered by negative news can lead to more selling as investors react to the initial decline.
- Technical Analysis and Patterns: Traders often use technical analysis based on historical price patterns. The popularity of certain patterns, such as head and shoulders or double tops, can create self-fulfilling prophecies as traders act based on anticipated market movements.
3. Global Economic Factors
Financial markets are intricately interconnected on a global scale. Economic conditions in one part of the world can reverberate across borders, affecting markets worldwide. Geopolitical tensions, economic crises, or unexpected policy changes can unleash widespread and unpredictable consequences on financial markets.
Global economic factors play a pivotal role in influencing the unpredictability of financial markets. The interconnectedness of economies across the world means that events and conditions in one region can have widespread and sometimes unexpected consequences on markets globally. Here’s a more detailed exploration of global economic factors affecting market unpredictability:
Interest Rates and Monetary Policy
- Central Bank Actions: Changes in interest rates and monetary policy decisions by central banks have profound effects on global markets. Adjustments in interest rates can impact borrowing costs, currency exchange rates, and investor behavior.
- Carry Trades: Global investors engage in carry trades, borrowing in low-interest-rate currencies to invest in higher-yielding assets. Shifts in interest rate differentials can lead to abrupt changes in capital flows, affecting exchange rates and asset prices.
Inflation and Deflation
- Purchasing Power and Consumer Behavior: Inflation erodes purchasing power, influencing consumer behavior and corporate planning. Rapid inflation can lead to interest rate hikes, impacting financial markets, while deflationary pressures may prompt central banks to adopt stimulus measures.
- Nominal vs. Real Returns: Investors are concerned not only with nominal returns but also with real returns adjusted for inflation. Unexpected inflation or deflation can disrupt expectations and affect asset valuations.
Currency Exchange Rates
- Trade Balances: Fluctuations in currency exchange rates impact trade balances and corporate earnings. Changes in exchange rates can result from economic indicators, geopolitical events, or shifts in market sentiment.
- Currency Interventions: Central banks and governments may intervene in currency markets to stabilize or influence their currencies. These interventions can introduce additional uncertainty and affect the competitiveness of exports.
Geopolitical Events
- Trade Relations: Trade tensions, tariffs, and trade agreements impact global markets, particularly those of countries directly involved. Uncertainty surrounding trade relations can lead to market volatility and affect specific industries.
- Political Instability: Geopolitical events, such as conflicts, political crises, or regime changes, can lead to uncertainty and affect investor confidence. Markets often react to geopolitical developments with sudden and unpredictable movements.
Global Economic Indicators
- GDP Growth: Global economic growth rates influence corporate earnings, investment decisions, and overall market sentiment. Slowdowns or contractions in major economies can have widespread effects on financial markets.
- Employment Figures: Labor market indicators, such as unemployment rates, affect consumer spending and confidence. Unanticipated changes in employment figures can lead to market volatility.
Commodity Prices
- Energy Prices: Fluctuations in oil and gas prices impact production costs, inflation, and the profitability of energy-related companies. Changes in energy prices also affect consumer spending patterns.
- Base Metals and Agriculture: Prices of base metals and agricultural commodities can influence industries dependent on these resources. Commodity price movements are often linked to global supply and demand dynamics.
Sovereign Debt and Fiscal Policies
- Debt Levels: High levels of sovereign debt can raise concerns about a country’s ability to meet its obligations. Fiscal policies and government spending decisions can impact economic stability and market perceptions.
- Austerity Measures: Implementation of austerity measures or expansionary fiscal policies can have consequences for economic growth, public sentiment, and financial market stability.
Emerging Markets Vulnerabilities
- Currency Crises: Emerging markets may face challenges related to currency devaluation, capital flight, or debt defaults. These events can have contagion effects on global markets.
- Political and Economic Reforms: Structural reforms or political changes in emerging markets can lead to uncertainties, affecting investor confidence and market dynamics.
4. Market Sentiment
Investor sentiment is prone to rapid swings based on news, rumors, and psychological factors. Positive or negative sentiment can trigger sudden and substantial market movements, introducing complexity to predicting short-term fluctuations; therefore, market sentiment is a complex and multifaceted aspect of financial markets that reflects the collective emotions and expectations of investors. It is a crucial element in understanding market dynamics, and its impact can be felt across various timeframes and asset classes. Traders and investors often incorporate sentiment analysis into their decision-making processes to gain insights into potential market movements.
Market sentiment refers to the overall attitude, mood, or opinion of investors and traders toward a particular financial market, asset, or investment. It is a collective perception of market participants regarding the future direction of prices. Market sentiment plays a crucial role in influencing trading decisions, impacting asset prices, and contributing to market dynamics. Here are detailed aspects of market sentiment:
Components of Market Sentiment
- Bullish Sentiment: A bullish market sentiment reflects optimism among investors, anticipating rising prices. Traders with a bullish outlook expect upward trends and are likely to buy or hold assets in anticipation of future gains.
- Bearish Sentiment: Bearish market sentiment indicates pessimism, with investors anticipating declining prices. Traders with a bearish outlook may sell assets or take short positions, betting on a market downturn.
- Neutral Sentiment: Some market participants may adopt a neutral stance, indicating a lack of strong bias towards bullish or bearish trends. Neutral sentiment can result from uncertainty or a balanced view of market conditions.
Drivers of Market Sentiment
- News and Events: Market sentiment is heavily influenced by news, economic indicators, corporate earnings reports, and geopolitical events. Positive or negative news can trigger shifts in sentiment, leading to rapid market movements.
- Economic Data Releases: Reports on economic indicators such as GDP growth, employment figures, inflation rates, and manufacturing data can significantly impact market sentiment. Unexpected data can lead to a reassessment of market expectations.
- Corporate Earnings: The financial performance of companies, as reflected in earnings reports, influences investor sentiment. Strong earnings may boost confidence, while weak earnings can lead to negative sentiment.
- Geopolitical Developments: Political events, trade tensions, and geopolitical crises can create uncertainty and influence market sentiment. Investors closely monitor developments that may have global economic implications.
- Social Media and Online Forums: The advent of social media has provided a platform for investors to share opinions and information rapidly. Trends on social media platforms and financial forums can amplify sentiment and influence trading decisions.
Indicators of Market Sentiment
- Put-Call Ratios: The put-call ratio measures the number of put options relative to call options. A high put-call ratio may indicate bearish sentiment, suggesting a higher demand for options that profit from declining prices.
- Volatility Index (VIX): Commonly known as the “fear index,” the VIX measures market volatility and is often used as an indicator of investor sentiment. Higher VIX levels suggest increased market uncertainty and potential fear.
- Sentiment Surveys: Various surveys and indices gauge investor sentiment. For example, the American Association of Individual Investors (AAII) surveys its members to assess bullish, bearish, and neutral sentiment.
- Technical Analysis Indicators: Some technical indicators, such as moving averages, trendlines, and chart patterns, are used to identify shifts in sentiment. Sudden changes in price movements or the breach of key technical levels can signal shifts in sentiment. (See 00.)
Behavioral Finance Aspects
- Herd Behavior: Investors often follow the crowd, leading to herding behavior. When a large number of market participants exhibit the same sentiment, it can intensify trends and contribute to market bubbles or crashes.
- Loss Aversion: Behavioral biases, such as loss aversion, influence sentiment. Investors may react more strongly to potential losses than gains, impacting their risk tolerance and trading decisions.
- Recency Bias: Recent events often have a disproportionate impact on sentiment. Traders may extrapolate recent trends into the future, leading to overreactions based on recent market movements.
Impact on Market Dynamics
- Trend Amplification: Positive sentiment can lead to a self-reinforcing upward trend as more investors join the bullish camp. Conversely, negative sentiment can intensify downtrends through increased selling pressure.
- Overbought and Oversold Conditions: Extreme bullish sentiment may lead to overbought conditions, signaling potential reversals. Similarly, extreme bearish sentiment may result in oversold conditions, suggesting a potential market bounce.
- Contrarian Opportunities: Contrarian investors often seek to capitalize on shifts in sentiment. When sentiment reaches extreme levels, contrarians may take positions opposing the prevailing view, anticipating a reversal.
5. Unforeseen Events
Natural disasters, political unrest, terrorist attacks, and other unforeseen events can significantly impact markets. The unpredictable nature of such occurrences makes it challenging to anticipate their effects, and the consequences can extend far beyond initial expectations. Understanding both unforeseen events and black swans is crucial for risk management and decision-making, as they can have far-reaching consequences on economies, industries, and financial markets. While unforeseen events are unexpected by nature, black swans are characterized by their extreme rarity and their ability to reshape the global landscape.
Unforeseen Events
Unforeseen events, also known as unforeseen circumstances or unexpected occurrences, refer to events that are challenging or impossible to predict and have significant consequences. These events disrupt the normal course of events and often lead to unpredictable outcomes. Here are detailed aspects of unforeseen events with short examples:
- Natural Disasters: The earthquake and tsunami in Japan in 2011 disrupted global supply chains, affecting industries worldwide. The severity and timing of such natural disasters are difficult to predict accurately.
- Technological Failures: The WannaCry ransomware attack in 2017 affected computer systems globally, highlighting the vulnerability of technology infrastructure to unforeseen cyber threats.
- Political Turmoil: Sudden changes in political leadership or unexpected policy shifts, like Brexit in 2016, can create uncertainty and impact financial markets and international relations.
- Global Health Crises: The emergence of the COVID-19 pandemic in 2019 had profound effects on public health, economies, and daily life, catching the world off guard.
- Market Flash Crashes: The “Flash Crash” in May 2010 saw a rapid and severe drop in stock prices, followed by a quick recovery, demonstrating the unpredictability of market dynamics.
Black Swans
Black swans refer to highly improbable and unforeseen events that have a significant impact, defying conventional predictions. These events are characterized by their rarity and the difficulty in anticipating them. Here are detailed aspects of black swans with short examples:
- Financial Crisis of 2008: The global financial crisis, triggered by the collapse of Lehman Brothers, was a black swan event. The severity and rapid spread of the crisis were largely unforeseen, leading to a widespread economic downturn and financial instability.
- COVID-19 Pandemic: The emergence of the COVID-19 pandemic in 2019 was a classic black swan. The unprecedented nature of the virus, its rapid global spread, and the resulting economic and social impacts were difficult to predict.
- 9/11 Terrorist Attacks: The terrorist attacks on September 11, 2001, in the United States were black swan events that had far-reaching consequences. The sudden and coordinated nature of the attacks led to significant geopolitical shifts and changes in security measures worldwide.
- Oil Price Collapse in 2020: The sudden collapse of oil prices in early 2020, driven by a combination of oversupply and decreased demand amid the COVID-19 pandemic, was an unforeseen event that had profound implications for the energy industry and financial markets.
- Swiss Franc Depegging in 2015: The Swiss National Bank’s decision to depeg the Swiss Franc from the Euro in 2015 was unexpected and resulted in significant currency fluctuations, impacting financial institutions and traders who were caught off guard.
6. Complexity of Financial Instruments
Financial markets involve a diverse range of intricate instruments, including derivatives, options, and futures. The interactions between these instruments and their underlying assets contribute to market complexity, making it difficult to foresee how various assets will respond to changes in market conditions.; therefore, the complexity of financial instruments introduces layers of intricacy into markets, making them more susceptible to unpredictable movements. Market participants, regulators, and investors must navigate this complexity carefully, considering its potential impact on risk management, market stability, and the overall predictability of financial markets.
Financial instruments can range from straightforward stocks and bonds to highly complex derivatives, options, and structured products. The complexity of these instruments can contribute to market unpredictability in several ways:
- Diverse Product Structures: Financial markets offer a wide array of instruments with varying structures and features. For example, derivatives like options and futures have unique characteristics such as expiration dates, strike prices, and contract specifications. The diversity of products introduces complexity, making it challenging for market participants to grasp the intricacies of each instrument.
- Interconnectedness and Derivatives Markets: Financial instruments are often interconnected. Derivatives, in particular, are contracts derived from underlying assets, and their values are influenced by various factors. The extensive use of derivatives for hedging or speculative purposes can amplify market movements and contribute to unpredictability. For instance, a large options position expiring could trigger significant buying or selling activities in the underlying asset.
- Leverage and Margin Trading: Complex financial instruments often involve the use of leverage, allowing traders to control larger positions with a smaller upfront investment. While leverage can amplify profits, it also increases the risk of significant losses. Unpredictable market movements, especially when combined with leverage, can lead to rapid and substantial price swings.
- Algorithmic Trading Strategies: Algorithmic trading relies on complex mathematical models and algorithms to execute trades at high speeds. The use of sophisticated trading strategies, including those involving complex financial instruments, can contribute to market unpredictability. For instance, algorithmic trading based on technical indicators or arbitrage opportunities can lead to rapid and unexpected price changes.
- Structured Products and Securitization: Financial institutions create structured products by bundling and repackaging various financial assets. Examples include collateralized debt obligations (CDOs) or mortgage-backed securities (MBS). The complexity of these products and the opaque nature of underlying assets can lead to difficulties in assessing risk. The global financial crisis of 2008 was exacerbated by the complexity and interconnectivity of such structured products.
- Oversight and Regulation Challenges: Regulating complex financial instruments presents challenges for oversight bodies. Regulatory frameworks may struggle to keep pace with the rapid evolution of financial markets and the development of new instruments. This lag in regulation can lead to gaps in oversight, potentially contributing to market unpredictability.
- Behavioral Impact on Market Participants: The complexity of financial instruments can influence market participants’ behavior. Investors may react differently to complex products based on their understanding, risk tolerance, and market sentiment. Misinterpretation or miscalculation of the risks associated with complex instruments can contribute to unexpected market moves.
- Market Liquidity Issues: Complex financial instruments may lack liquidity, especially during times of market stress. Illiquidity can exacerbate volatility as market participants struggle to execute trades at desired prices. For example, certain exotic derivatives may experience sudden liquidity drying up during periods of uncertainty.
7. Market Participants’ Reactions to News
Even when an event is anticipated, the market’s reaction may diverge from expectations due to the varied ways participants interpret and respond to information. Traders’ reactions to the news are influenced by psychological factors, introducing an element of unpredictability to market dynamics. Market participants’ reactions to the news are complex and multifaceted, driven by psychological biases, herding behavior, and the interpretation of information. This collective response contributes significantly to the unpredictability of price movements in financial markets.
“Market Participants’ Reactions to News” is a key driver of price unpredictability in financial markets. How investors interpret and respond to news, rumors, or information plays a significant role in determining the direction and magnitude of market movements. The complex interplay of psychological, behavioral, and economic factors among market participants contributes to the unpredictability of price changes. Here’s a detailed exploration with examples:
- Psychological Factors: Positive news about a company’s earnings may trigger optimism among investors, leading to buying activity and a surge in the stock price. Conversely, negative news, even if anticipated, can prompt panic selling and a rapid decline in stock value. The emotional responses of market participants, such as fear and greed, contribute to unpredictable price swings.
- Herd Behavior: When a significant market-moving event occurs, investors may tend to follow the crowd, amplifying the impact of the news. For instance, if a sudden surge in buying activity is observed, other investors might fear missing out and join the buying frenzy, creating a self-fulfilling prophecy. This herd behavior can lead to exaggerated and unpredictable market movements.
- Information Interpretation: The way market participants interpret news can vary widely. For instance, positive economic data may be viewed optimistically by some investors, leading to buying, while others may interpret the same data with caution due to concerns about potential consequences, resulting in a mixed and unpredictable market response.
- Overreaction and Underreaction: Market participants may overreact or underreact to news, leading to price movements that are disproportionate to the information’s actual significance. Overreaction occurs when there is an exaggerated response to news, while underreaction involves a delayed or muted response. These tendencies contribute to market unpredictability.
- Algorithmic Trading Impact: Algorithmic trading systems are programmed to react swiftly to news based on predefined rules. If a news event triggers a large number of algorithmic trades simultaneously, it can lead to rapid and unexpected price movements. The speed and scale of algorithmic reactions contribute to market volatility.
- Market Sentiment: Investor sentiment can change rapidly based on news flow. Positive or negative sentiment can influence market participants’ decisions, impacting buying or selling activity. News that contradicts prevailing sentiment may lead to sudden reversals or accelerations in price changes.
- Earnings Reports and Guidance: When a company releases quarterly earnings that surpass market expectations, there may be a surge in buying as investors perceive the company as performing well. Conversely, if a company provides weak guidance for future earnings, it can lead to a sell-off. The extent of these reactions depends on the degree to which the news deviates from expectations.
- Unforeseen Events: Unpredictable events, such as natural disasters or geopolitical crises, can lead to unexpected market reactions. For instance, a sudden announcement of new trade tariffs or the occurrence of a major geopolitical event may trigger a swift and unpredictable response from market participants.
- Market Reaction to Economic Indicators: Economic indicators, such as employment reports or inflation data, can influence market expectations. A surprise in these indicators can lead to market volatility as participants adjust their positions based on the unexpected data.
- Social Media Influence: Information spreads rapidly through social media platforms. News or rumors circulated on social media can lead to abrupt market movements as traders react to the perceived significance of the information. The virality of social media content can contribute to unpredictability.
8. Algorithmic Trading
The prevalence of algorithmic trading introduces an additional layer of complexity. Automated trading systems can execute trades at speeds and frequencies that surpass human capabilities, leading to swift and unpredictable market movements. The technical intricacies of algorithmic trading are continuously evolving as technology advances. Market participants employing algorithmic trading strategies must stay abreast of the latest developments in hardware, software, and data analytics to maintain a competitive edge in the fast-paced and dynamic landscape of financial markets.
Algorithmic trading, also known as Algo-Trading or automated trading, represents a sophisticated and technologically advanced approach to executing financial transactions in the global markets. It involves the use of computer algorithms, mathematical models, and predefined rules to automate the process of placing, managing, and executing trades. The technical details of algorithmic trading include:
Algorithm Design:
- Strategies: Algorithms are designed based on specific trading strategies, which can be quantitative, qualitative, or a combination of both. These strategies may involve statistical analysis, mathematical models, technical indicators, or machine learning algorithms to identify trading opportunities.
- Parameters and Inputs: Algorithms utilize various parameters and inputs to make trading decisions. These inputs can include historical price data, trading volume, volatility measures, and other relevant financial indicators. The fine-tuning of parameters is a critical aspect of algorithm design.
- Execution Algorithms: Algorithms for executing trades are designed to minimize market impact and optimize execution costs. These algorithms consider factors such as liquidity, order book dynamics, and market conditions to execute trades efficiently.
Data Processing and Analysis:
- High-Frequency Trading (HFT): Algo trading often involves high-frequency trading strategies that require processing vast amounts of market data in real-time. HFT algorithms aim to exploit small price differentials and capitalize on short-term market inefficiencies.
- Market Data Feeds: Algorithms rely on fast and reliable market data feeds that provide real-time information on price movements, order book dynamics, and other relevant market conditions. Low-latency data processing is crucial for timely decision-making.
Execution Speed and Co-location:
- Low-Latency Infrastructure: To achieve high execution speeds, algo traders often invest in low-latency infrastructure. This includes proximity hosting services, where trading servers are physically located close to exchange servers to reduce data transmission delays.
- Co-location Facilities: Algorithmic trading firms may colocate their servers in data centers provided by exchanges. This ensures minimal network latency and gives traders a competitive advantage in executing orders quickly.
Order Types and Routing:
- Smart Order Routing (SOR): Algo trading systems use smart order routing algorithms to determine the optimal execution venue for trades. SOR algorithms consider factors such as liquidity, transaction costs, and market conditions to route orders intelligently.
- Order Types: Algorithms can employ various order types, including market orders, limit orders, and more sophisticated order types like iceberg orders or time-weighted average price (TWAP) orders. The choice of order types depends on the specific trading strategy and objectives.
Risk Management:
- Pre-Trade Risk Controls: Algo trading systems incorporate pre-trade risk controls to manage exposure and prevent erroneous or excessive trades. These controls may include limits on order size, value-at-risk (VaR) checks, and other risk mitigation measures.
- Real-Time Monitoring: Ongoing risk monitoring during live trading is crucial. Algorithms continuously assess market conditions and adjust strategies or halt trading if predefined risk thresholds are breached.
Backtesting and Optimization:
- Historical Testing: Algo traders extensively backtest their algorithms using historical data to assess performance under various market conditions. Backtesting helps identify potential issues and refine algorithms before deploying them in live markets.
- Optimization Techniques: Traders use optimization techniques to fine-tune algorithm parameters for better performance. This process involves adjusting variables, testing different combinations, and optimizing algorithms to improve risk-adjusted returns.
Machine Learning Integration:
- Predictive Modeling: Some algorithmic trading strategies incorporate machine learning models for predictive analytics. These models analyze historical data to identify patterns and trends, enabling algorithms to make more informed trading decisions.
- Reinforcement Learning: In certain cases, algorithms use reinforcement learning to adapt and evolve based on feedback from market outcomes. This allows algorithms to learn from experience and continuously improve their performance.
Regulatory Compliance:
- Compliance Checks: Algorithmic trading systems adhere to regulatory requirements and market rules. Compliance checks are integrated into algorithms to ensure adherence to position limits, market regulations, and other relevant compliance measures.
Market Impact and Liquidity:
- Market Impact Modeling: Algorithms assess potential market impact before executing large trades. Market impact models estimate the impact of trades on prices and liquidity, helping algorithms optimize execution strategies.
- Liquidity Provision: Some algorithms are designed to act as liquidity providers, placing passive orders in the order book to capture the bid-ask spread. This liquidity provision strategy aims to profit from market participants willing to pay the spread.
َََAlgorithmic Trading Platforms
Selecting the “best” algorithmic trading software can depend on individual preferences, trading strategies, and specific requirements. It is essential to note that the landscape of algorithmic trading software is dynamic, and the popularity and effectiveness of platforms can change over time. Additionally, the “best” platform depends on individual preferences, trading strategies, and specific requirements. Here are 10 algorithmic trading software platforms that have been widely recognized:
MetaTrader is a popular trading platform that supports algorithmic trading through Expert Advisors (EAs) written in MQL4 and MQL5. It is widely used for forex trading and offers a range of technical analysis tools.
NinjaTrader is a comprehensive trading platform that supports algorithmic trading. It provides advanced charting, analysis tools, and allows users to develop and implement automated trading strategies.
QuantConnec is an open-source algorithmic trading platform that supports multiple asset classes. It allows users to code trading strategies in C# or Python and deploy them on various brokerage platforms.
Interactive Brokers’ Trader Workstation (TWS) is a robust trading platform that supports algorithmic trading. It provides access to a wide range of financial instruments, advanced order types, and API connectivity for automated trading.
TradeStation is a popular platform for active traders and supports algorithmic trading. It offers a user-friendly interface, advanced charting, and a proprietary programming language called EasyLanguage.
AlgoTrade is a platform designed specifically for algorithmic trading. It supports various asset classes and provides tools for strategy development, backtesting, and live trading.
Quantopian is a web-based platform that allows users to develop and test algorithmic trading strategies in Python. It provides access to historical data and a community for sharing and collaboration.
Zipline is an open-source backtesting library for Python developed by Quantopian. While it’s primarily used for backtesting, it can be integrated with other tools for live trading.
AgenaTrader is a platform that caters to both manual and algorithmic traders. It offers various features, including charting, analysis tools, and supports the development of custom trading strategies.
cTrader is a forex trading platform that supports algorithmic trading through cAlgo. Traders can develop custom indicators and automated trading strategies using C#.
Before choosing an algorithmic trading platform, it’s crucial to consider factors such as ease of use, programming language support, available features, backtesting capabilities, and compatibility with preferred brokers. Additionally, always check for the most recent reviews and user feedback to ensure that the chosen platform meets your specific requirements. Keep in mind that the algorithmic trading landscape is dynamic, and new platforms may emerge over time.
9. Macro-Economic Indicators
Economic indicators such as interest rates, inflation, and employment figures play a pivotal role in influencing market behavior. Macro-economic indicators are key statistics and data points that provide insights into the overall health and performance of a country’s economy. These indicators include various aspects such as interest rates, inflation rates, employment figures, GDP (Gross Domestic Product), and more. Market participants closely monitor these indicators as they can significantly impact investment decisions, financial markets, and economic policies; However, the interpretation of these indicators is not always straightforward, and unexpected changes or revisions can catch market participants off guard, further contributing to market unpredictability.
Macro-Economic Indicators
- Interest Rates refer to the cost of borrowing or the return on investment for holding or lending money. Central banks often set benchmark interest rates to influence economic activity. If a central bank raises interest rates, borrowing becomes more expensive, leading to reduced spending and potential economic slowdown. Conversely, lowering interest rates may stimulate borrowing and spending, boosting economic activity.
- Inflation measures the rate at which the general level of prices for goods and services rises, leading to a decrease in purchasing power. Moderate inflation is generally considered normal for a growing economy. However, rapid inflation erodes purchasing power, affecting consumer spending and investment decisions. Central banks aim to maintain stable inflation rates.
- Employment Figures including the unemployment rate and non-farm payrolls, indicate the health of the job market and overall labor force participation. A decreasing unemployment rate and rising job creation typically suggest economic growth. However, unexpectedly high unemployment rates or a decline in job creation can be indicative of economic challenges, affecting consumer confidence and spending.
- Gross Domestic Product (GDP) measures the total value of all goods and services produced within a country’s borders over a specific time period. Positive GDP growth indicates economic expansion, while negative growth may signal a contraction. Changes in GDP influence corporate profits, employment, and investment decisions.
Macro-Economic Interpretation Challenges
- Unforeseen Revisions: Initial economic indicators, such as GDP growth or employment figures, are often subject to revisions. Unexpected changes in revised data can catch market participants off guard. For instance, a positive initial report may be revised downward, leading to market volatility.
- Conflicting Indicators: Sometimes, different economic indicators may provide conflicting signals. For instance, low unemployment rates may suggest a robust economy, but if accompanied by high inflation, it could indicate challenges like overheating.
- Market Expectations vs. Actual Results: Markets often price in expectations based on analysts’ forecasts. Deviations from these expectations can lead to sudden market reactions. For instance, if interest rates are expected to rise by a certain percentage, a more aggressive move can trigger volatility.
- Global Economic Factors: Economic indicators can be influenced by global factors. For instance, a trade war between major economies can impact employment and GDP growth, leading to unexpected outcomes in individual countries.
- Central Bank Communication: Central banks communicate their intentions regarding interest rates and monetary policy. Unexpected statements or changes in communication can lead to market uncertainty. For instance, if a central bank hints at a rate hike but delays it unexpectedly, markets may react unpredictably.
Macro-Economic Effects on Market Unpredictability
- Volatility Spikes: Unexpected changes in economic indicators can lead to sudden spikes in market volatility. For instance, if an employment report shows a significant deviation from expectations, it can trigger rapid price movements.
- Shifts in Investor Sentiment: Surprising economic data can alter investor sentiment. Positive data may boost confidence and lead to increased risk appetite, while negative data can have the opposite effect, causing risk aversion.
- Repricing of Assets: Unforeseen changes in economic indicators may prompt market participants to reassess the value of assets. This repricing can lead to rapid adjustments in asset prices.
- Policy Adjustments: Central banks and policymakers may respond to unexpected economic indicators with policy adjustments. For example, a central bank might change interest rates or modify monetary policy, influencing market conditions.
- Algorithmic Trading Impact: Algorithmic trading systems, programmed to react to economic data releases, can exacerbate market movements. High-frequency algorithms may execute large volumes of trades in response to unexpected indicators, contributing to rapid price changes.
00. A Brief Introduction to Technical Analysis
Technical analysis involves examining various markets such as commodities, stocks, indices, and futures primarily through charts. It focuses on price and volume, with open interest data included in futures analysis. John J. Murphy’s interpretation aligns with the Efficient Market Hypothesis, which suggests that all relevant information is already reflected in market prices. Technical analysis relies heavily on charts and past price patterns, distinguishing it from fundamental analysis of economic data and news.
In contrast to the conventional approach of relying on induction, Nassim Nicholas Taleb challenges the efficacy of drawing conclusions solely from past experiences, especially when it comes to forecasting future events. Taleb introduces the concept of black swan events, those rare and unforeseeable occurrences that wield substantial influence on market dynamics. He contends that historical data alone cannot provide accurate predictions for such events. A notable critique from Taleb is directed towards an excessive dependence on technical analysis, dismissing it as overly simplistic. Technical analysis often relies on historical price patterns and indicators, which, according to Taleb, may not adequately account for the potential impact of black swan events.
To navigate the inherent unpredictability and disruptive influence of black swan events, Taleb proposes the antifragility market theory. This theory suggests a portfolio strategy that goes beyond mere survival during periods of chaos; it advocates for investments that can thrive and derive benefit from unexpected and extreme market events. Antifragility implies building a portfolio that not only withstands shocks but gains strength from them. For example, an antifragile portfolio might include assets like options, which can profit from market volatility, or investments in sectors that historically show resilience during turbulent times, such as defensive stocks in healthcare or utilities.
In real-life terms, consider the financial crisis of 2008. Investors who heavily relied on historical data and conventional risk models faced substantial losses during the crisis, as the event was a black swan that defied traditional predictions. An antifragile portfolio, on the other hand, might have included investments in gold, government bonds, or alternative assets that historically exhibit inverse correlations with equities, providing a degree of protection or even gains during market downturns. Taleb’s antifragility concept urges investors to embrace uncertainty and design portfolios that not only endure unpredictability but capitalize on it for long-term success.
While technical analysis continues to study market fluctuations, theories such as Dow’s Market Theory aim to decode these fluctuations. This theory, developed in the late 19th century by Charles Dow, posits that financial markets move in trends that are classified into primary, secondary, and minor trends. It emphasizes the importance of confirming trends through both the Dow Jones Industrial Average (DJIA) and Dow Jones Transportation Average (DJTA) moving in the same direction, and that market prices already reflect all available information. Dow Theory suggests that a trend persists until proven otherwise.
Given the current landscape of weaponized Forex/commodity markets, relying on geopolitical analysts over charts would be my immediate choice. However, due to limited access to proficient analysts and reliable news sources, the objective of this discussion is to outline a set of fundamental principles that have proven useful in enhancing the critical assessment of commodity and forex forecasts. These same analytical tools are available to decision-makers within central banks and trading powerhouses, who possess the capability to anticipate market trends and potentially exert influence over them in alignment with their vested interests.
Starting with the basics of technical analysis, it’s essential to remember the following key points: Charts provide visual representations of price and volume data, offering varying levels of detail. Different timeframes offer diverse perspectives on price movements. Charts are instrumental in identifying trends, support, and resistance levels, with volume and open interest serving as additional factors to confirm or diverge from price trends. Understanding how to read and interpret various chart types is crucial for informed decision-making.
Traders and analysts use a range of technical analysis methods to forecast commodities and Forex. Here are some of the most commonly used ones:
- Support and Resistance Levels: These critical price points help gauge potential reversals or continuations. Moving averages, such as the 200-day moving average, also indicate long term support or resistance.
- Pivot Point Standard (SPP): Short-term traders use SPP to calculate support and resistance levels based on the previous session’s high, low, and close prices. It aids in identifying entry and exit points.
- Auto Fib Retracements: This method uses Fibonacci retracements to identify support and
resistance areas. The 61.8% retracement (“golden ratio”) is a significant level for potential reversals. - UO, RSI, Williams %R & MACD: These market momentum oscillators detect overbought or oversold conditions. The MACD indicator predicts market trends in two key scenarios. First, when the MACD Line crosses above the Signal Line, it suggests a potential upward trend. Second, when the MACD Line crosses above the Zero Line and changes from a negative value to a positive one, it indicates a bullish trend and vice versa.
- Average Directional Index (ADX): It assesses trend strength, with an ADX above 25 indicating a strong trend.
- OBV (On Balance Volume): It measures buying and selling pressure, often signaling potential trend reversals when diverging from actual price movements.
- Linear Regression Channel: It uses statistical linear regression to identify trends and make forecasts.
- Bollinger Bands: It measures price volatility based on the 20-day SMA and indicates increased volatility with wider band distances.
- Elliott Wave Theory: Based on repetitive wave patterns, it categorizes impulsive waves (numbered 1-5) and corrective waves (labeled A, B, C), often using Fibonacci Retracement Levels for reversal thresholds.
- Ichimoku Cloud: It provides a comprehensive view of trends, momentum, and
support/resistance levels. Prices above the cloud suggest strength, below it indicates weakness, and inside it suggests a transition. Different cloud colors (red or green) confirm downtrends or uptrends. - The Echo Forecast: The indicator, named “ECHO,” utilizes a time series forecasting method based on the correlation coefficient to estimate future prices from historical observations with similarities to recent price variations. Initially designed for forecasting periodic time series, the method later incorporated the option to experiment with dissimilar series, drawing inspiration from Lorenz’s analog method for predicting atmospheric data.
- The SuperTrend AI indicator combines K-Means clustering with the SuperTrend indicator to offer a novel approach to technical analysis. Users can interpret the AI trailing stop similarly to the regular SuperTrend indicator, with higher minimum/maximum factors providing longer-term signals, and displayed performance metrics aiding in trend direction analysis. The K-Means clustering is employed to optimize the SuperTrend factor, allowing users to experiment with different clusters for enhanced performance, and the indicator’s settings include ATR Length, Factor Range, Step, Performance Memory, and the option to choose the cluster source for the final factor.
- The Volume SuperTrend AI integrates traditional SuperTrend calculation with AI techniques, specifically the k-nearest neighbors (KNN) algorithm, to predict price trends by considering both price movement and trading volume. The indicator functions as a dynamic trailing stop loss, adjusting with price movement and volume, and offers customizable settings for AI parameters, trend signals, SuperTrend characteristics, and moving average sources to cater to individual trading strategies and market conditions. Additionally, the disclaimer emphasizes that the information provided does not constitute financial advice, and users are responsible for their investment decisions.
- The Volume-Supported Linear Regression Trend script, developed by LonesomeTheBlue, combines linear regression with volume analysis to assess trend direction and strength. Users can customize parameters such as source, short-term period, and long-term period to analyze trends and potential reversals, with the script offering insights into volume-supported trends and possible divergences.
Additionally, AI platforms too, analyze financial market data to predict future price movements. Various platforms and software leverage AI techniques to enhance traditional technical analysis methods. Here are key aspects with examples of AI technical analysis platforms:
Data Processing and Analysis
- Data Sources: AI platforms utilize diverse datasets, including historical market data, economic indicators, and news sentiment. Examples include Quandl, Alpha Vantage, and Intrinio.
- Data Preprocessing: Tools like Pandas and NumPy in Python are commonly used for cleaning and preprocessing financial data.
Machine Learning Algorithms
- Pattern Recognition: TensorFlow and PyTorch are popular frameworks for implementing neural networks that excel in pattern recognition.
- Supervised Learning: Scikit-learn and XGBoost are widely used for implementing supervised learning algorithms in finance for prediction tasks.
Predictive Modeling
- Time Series Analysis: Prophet by Facebook and ARIMA (AutoRegressive Integrated Moving Average) models are employed for time series forecasting in finance.
- Regression Analysis: Linear regression models implemented using Python libraries like Statsmodels or Scikit-learn for predicting numerical values.
Sentiment Analysis
- News and Social Media Monitoring: Natural Language Processing (NLP) libraries like NLTK and spaCy are used along with sentiment analysis tools such as VADER or TextBlob.
- Machine Learning for Sentiment Analysis: Platforms like Aylien and MonkeyLearn provide pre-built models for sentiment analysis.
Algorithmic Trading
- Automated Decision-Making: Algorithmic trading platforms like QuantConnect, Quantopian, and AlgoTrader integrate AI models to automate trading decisions.
- High-Frequency Trading (HFT): Platforms like QuantRocket are designed for high-frequency trading and support the integration of AI-driven strategies.
Deep Learning
- Neural Networks: TensorFlow and PyTorch are widely used for implementing deep learning models, including Recurrent Neural Networks (RNNs) or Long Short-Term Memory (LSTM) networks.
- Feature Extraction: Deep learning libraries aid in automatic feature extraction; Keras and TensorFlow offer convenient APIs for building complex neural network architectures.
Portfolio Optimization
- Risk Management: Platforms like QuantConnect and Quantlib provide tools for risk management and portfolio optimization.
- Diversification Strategies: AlgoTrader and Wealthfront use AI techniques for optimizing asset allocations based on risk and return objectives.
Adaptability and Learning
- Adaptive Models: AI platforms with reinforcement learning capabilities, like OpenAI’s Gym, allow models to adapt and learn iteratively from changing market conditions.
- Reinforcement Learning: TensorForce and Ray RLlib are frameworks suitable for implementing reinforcement learning in finance.
Interpretable AI
- Explainability: LIME (Local Interpretable Model-agnostic Explanations) and SHAP (Shapley Additive exPlanations) are Python libraries used to enhance the interpretability of AI models in finance.
Challenges and Risks:
- Overfitting: Platforms like QuantConnect and Quantlib often incorporate techniques to mitigate overfitting challenges in AI models.
- Data Quality: Data providers such as Alpha Vantage and Quandl aim to deliver high-quality financial data for accurate analysis.
- Market Dynamics: AI-powered platforms need to consider dynamic market conditions, and tools like Backtrader provide simulation environments for testing strategies.
Various platforms and software leverage AI techniques to enhance technical analysis in financial markets. From data processing to algorithmic trading and portfolio optimization, these platforms integrate AI-driven solutions to provide traders and investors with advanced tools for decision-making in the complex world of finance.
These basic tools – AI or else – help traders and analysts make well-informed trading decisions. They also help assess market conditions or, in simpler terms, adopt a more analytical approach when the market throws us a curveball, trying to predict the unpredictable as accurately as possible.
… and finally if you made it this far reading through the article and you are curious about discovering the next big cryptocurrency gem, you can use Dextools‘ sorting and filtering features to explore new and potentially promising tokens. Keep in mind that investing in cryptocurrency always involves risks, and it’s essential to do your own research before making any investment decision as cryptos are generally a game of get in early and get out fast before anyone else does. Here are some suggestions for optimizing settings to discover newly launched tokens:
- Sort by New you can usually sort tokens (not coins) by various criteria. Look for an option to sort by the newest listings or recently launched tokens. This can help you find projects in their early stages.
- Filter by Liquidity Set a minimum liquidity threshold to filter out tokens with extremely low liquidity. This can help you focus on tokens that have at least some level of market activity.
- Volume Filters Apply volume filters to identify tokens with a certain level of trading activity. This can help you spot tokens that are gaining attention and interest.
- Social Media Integration Some platforms integrate social media data. Check if Dextools has features that display social media activity related to specific tokens. High social media engagement can be an indicator of a growing community.
- Market Cap Filters Consider setting a filter for a specific market cap range. This can help you focus on projects that are still relatively small but have the potential for growth.
- Token Age Look for a feature that allows you to filter tokens based on their age. Newly launched tokens may have more potential for rapid growth.
- Smart Contract Audits Check if Dextools provides information about smart contract audits. Tokens that have undergone security audits may be considered more trustworthy.
- Community Activity Look for tokens with active communities. Some platforms provide data on community size and engagement, which can be a positive sign.
Remember that investing in early-stage or newly launched tokens is speculative and comes with higher risks. Always perform due diligence, read the project’s whitepaper, understand its utility, and assess the risks associated with the team and technology. Additionally, stay updated on market trends and be cautious of potential scams in the cryptocurrency space.
As with everything else, you can always find alternatives if you look for them; there are several alternatives to Dextools for tracking and analyzing cryptocurrencies. Each platform may have its unique features, and the effectiveness of these tools can depend on personal preferences and specific use cases. Here are some alternatives you may consider:
- CoinGecko: CoinGecko is a popular cryptocurrency data aggregator that provides comprehensive information about various tokens. It includes market data, community metrics, developer activity, and more. CoinGecko allows users to discover new tokens and track their performance.
- CoinMarketCap: CoinMarketCap is one of the most widely used cryptocurrency tracking platforms. It provides information on market capitalization, trading volumes, price movements, and other key metrics. CoinMarketCap also has a feature for discovering new tokens.
- TokenSniffer: The Token Sniffer stands out as a top-notch tool for detecting potential scam tokens, given the proliferation of various malicious schemes within the DeFi space aimed at defrauding individuals of their funds. Safeguarding the secure trading of tokens on DeFi platforms is imperative in light of these threats.
- PooCoin: PooCoin is a platform that specializes in tracking tokens on the Binance Smart Chain (BSC). It provides charts, trading information, and other relevant data for BSC tokens.
- Uniswap: Uniswap is a decentralized exchange (DEX) built on the Ethereum blockchain. While it’s primarily an exchange, it also serves as a platform for discovering new tokens, especially those associated with decentralized finance (DeFi) projects.
- DappRadar: DappRadar focuses on tracking decentralized applications (DApps) on various blockchains, including Ethereum, Binance Smart Chain, and others. It can be useful for discovering new projects and understanding their user activity
- Dexguru: DexGuru is a decentralized finance (DeFi) platform designed to provide users with advanced tools and analytics for trading on decentralized exchanges (DEXs), tracking whales, sharks, turtles and bots!
- Whale Stat: The name speaks for itself.
- Cryptorank: Cryptorank is a cryptocurrency analytics platform that offers market data, price charts, and other relevant information. It includes features for discovering trending coins and understanding market sentiment.
Before making any investment decisions with these tools, it is crucial to thoroughly research the options available. Keep in mind that the cryptocurrency market is incredibly dynamic, and information can evolve swiftly. Stay updated on market trends, diligently investigate projects, and exercise caution, particularly in the realm of potential risks and scams within the crypto space, such as Pump & Dump schemes. It’s important to note that money doesn’t simply grow on trees, especially in an environment where Federal Reserve rates are at historically high levels.
In its pursuit of taming inflation, the Federal Reserve faces a unique challenge, with a focus on achieving a soft landing rather than fearing a recession. Despite the unconventional approach, the Fed’s efforts to curtail inflation through aggressive rate hikes have not yielded the desired results yet.
The Fed aims to strike a balance without causing severe economic disruptions, adhering to the Phillips Curve theory, which links unemployment and inflation. Unlike the conventional belief that only a deep recession can combat inflation, the Fed seeks a more nuanced strategy.
The potential trigger for this approach lies in concerns over a Chinese Shadow Banking Contagion. Fears of a global economic downturn are rooted in China’s property bubble and debt issues, posing challenges to the world’s economic stability. Recent developments in China, including a stimulus cut, lower economic growth projections, and financial issues in the real estate sector, contribute to the complexity of the situation. Global debt levels, significantly higher than in previous inflationary periods, pose a hurdle for the Federal Reserve in combating inflation through conventional means, such as higher interest rates. Emerging markets with elevated debt-to-GDP ratios, like Pakistan, face heightened risks, especially if the US dollar strengthens.
To address the complexity of the situation, the Fed must prioritize managing high-interest payments on private and federal debts. The potential consequences of this challenge could include bankruptcies and the need for austerity measures, calling it “The Mother of All Pain Trades.” to reach the %2 inflation target.
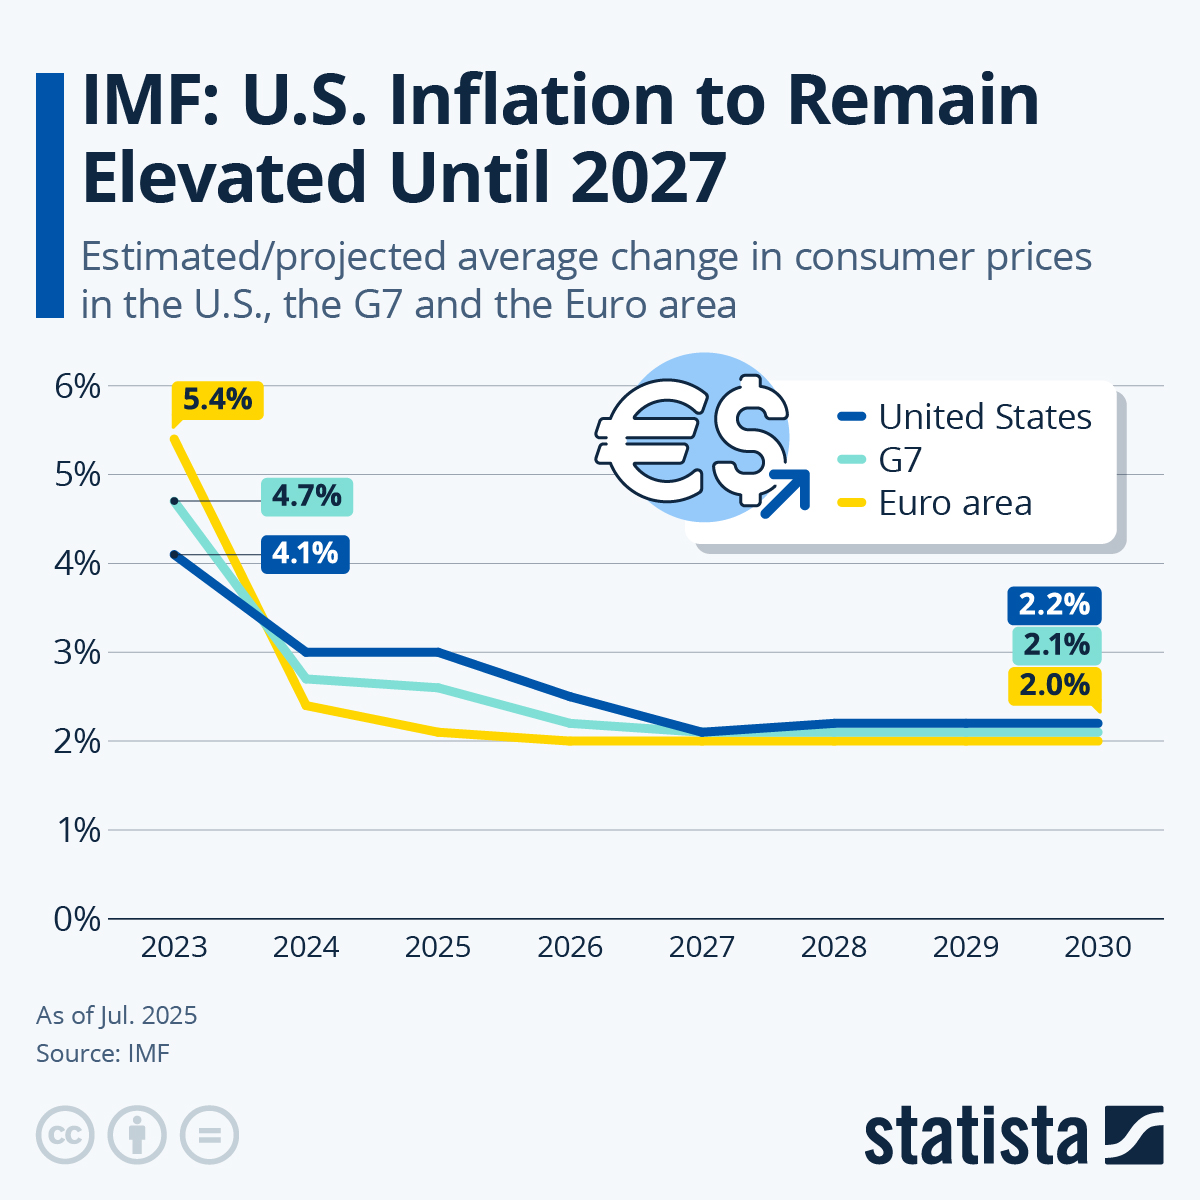 This chart shows the IMF’s latest inflation forecast for the United States and the Euro area. Statista