

What is Data Analysis
Data analysis is an essential tool for businesses looking to explore global value chains for import-export opportunities. By leveraging data insights, businesses can grasp market trends, consumer behavior, and competitor strategies, enabling them to identify untapped markets, optimize supply chains, and make informed decisions about product development and pricing. Data analysis also allows businesses to track performance, identify areas for improvement, and adapt quickly to changing market conditions, ensuring competitiveness in today’s global economy.
Simple statistical methods such as aggregation and trend projections on UN Commodity data can help exporters discover potential target markets. Aggregation groups similar commodities, providing clarity on demand across regions, while trend analysis identifies emerging markets and declining product trends, assisting exporters in strategic decision-making. These methods offer valuable insights, enhancing export planning and decision-making processes effectively.
Development 350’s Data Lab transforms the complex global data landscape into straightforward charts categorized with HS (Harmonized System) Codes. These charts provide clarity on growing markets and opportunities, benefiting businesses and policymakers alike. By harnessing visualization and categorization, Development 350 provides clarity amidst complexity, empowering stakeholders to identify trends and make informed decisions. This approach facilitates the identification of burgeoning sectors and regions ripe for expansion, enabling users to navigate international trade confidently.
Focusing on key indicators such as export-import volume trends, market share analysis, and price trends, Development 350’s Data Lab offers actionable insights to support informed decision-making and drive business growth in the global marketplace.
The following G20 trade statistics summary highlights the significant economic impact of these nations. Despite representing 65% of the world’s population, G20 economies collectively contribute approximately 85% of the world’s total GDP, 78% of the world’s total exports, and 77% of the world’s total imports. These figures underscore the outsized economic impact and influence of the G20 economies on the global stage.
G20 Trade Summary
The G20 comprises 19 individual countries and the European Union, representing a significant portion of the global population, with approximately 5.3 billion people. This is in stark contrast to the G7, which consists of only seven nations and has a combined population of around 775 million.
Economically, the G20 outstrips the G7, generating a GDP of approximately $85 trillion compared to the G7’s $40 trillion. In terms of trade, the G20 dominates, contributing about 78% of the world’s total exports and representing around 77% of global imports. In contrast, the G7, while still influential, commands a smaller share of global exports and imports at around 46% and 43%, respectively.
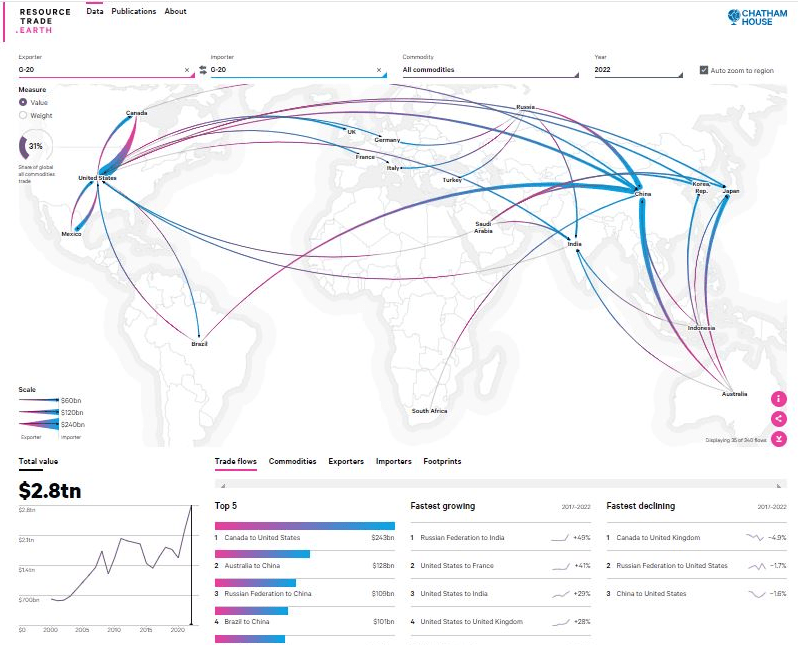
This comparison underscores the G20’s broader representation and economic influence on the global stage compared to the more exclusive G7. According to the United Nations, as of November 15, 2022, the world’s population has reached 8 billion. There are currently 195 countries in the world. However, the likelihood of any trade occurring beyond the G20 sphere is under 20%.
| Top 5 EXP By $ | Fastest Growing EXP 2017–22 | CMDTY Top 5 | Fastest Growing CMDTY 2017–22 | * Fastest Growing EXP 2012-22 | ** Fastest Growing IMP 2012-22 |
|---|---|---|---|---|---|
| Canada to US $243bn | nes to DE +2135% | Fossil Fuels $4.5tn | Fertilizers +19% | Vietnam $371bn +324% | Japan $900bn +98% |
| UAE to nes $221bn | Norway to DE +40% | Metals & Minerals $2.2tn | Fossil fuels +16% | Poland $360bn +191% | Australia $290bn +87% |
| Australia to CN $128bn | UAE to ,nes +31% | Agriculture $1.6tn | Metals & Minerals +8.9% | Ireland $208bn +182% | Brazil $270bn +86% |
| Russia to CN $109bn | Belgium to DE +30% | Forestry $219bn | Forestry +6.6% | China $3.7tn +175% | UK $816bn +84% |
| Brazil to CN $101bn | Australia to nes +30% | Pearls and Gemstones $157bn | Agriculture +5.7% | Türkiye $262bn +167% | HK,CN $670bn +83% |
** X >$200bn
Let’s consider a simple example. Around 50% of the world’s pasta imports were handled by select G20 members in 2022, highlighting the importance of key players in the market. Italy and Turkey together supply around 70% of the world’s pasta. Barilla is the top pasta brand worldwide, commanding a 34% share of the US market alone, while Walmart holds a significant 20% share of the US pasta market. Therefore, it’s plausible to suggest that both Barilla and Walmart together command a substantial share of the global pasta turnover.
Shifting away from market potential, the assessment of competitiveness can be simplified to price trend analysis. To illustrate, let’s revisit the pasta example.
The baseline import price of IRQ has consistently been lower than TRY’s global export price for pasta, which is $703/ton on average and $710/ton as a median. The top markets for pasta exports are the US, DE, and FR. Among these markets, the US has the largest untapped export potential, with additional exports valued at $417 million.
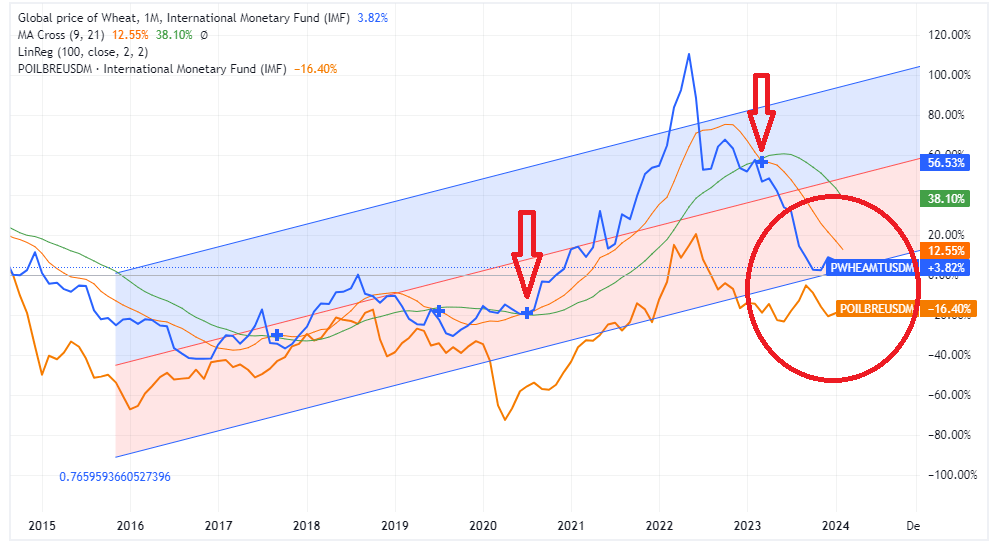
The chart depicted above illustrates the month-to-month fluctuations in Wheat prices per ton and Brent Crude prices per barrel throughout a ten-year period.
Several key points emerge:
- The occurrence of the MA Golden Cross on 2020/M7 and the MA Death Cross on 2023/M3 signify the conclusion of a bullish cycle for Wheat.
- A bounce-back in prices or a price rebound observed in 2024/M2 could indicate a potential bottoming out of Wheat prices, possibly signifying a reversal in trend.
- The positive correlation between Wheat and Brent prices ended abruptly by Q3 of 2023, signaling recession, thus less demand
Furthermore, By analyzing import data, we can conclude that FR, DE, and the US are promising export markets for Italian pasta exporters. FR has the most potential for additional exports worth $170 million (about 5000 truckloads). Turkey’s primary export markets are IRQ, the US, and SO (Somalia). IRQ has the most significant untapped potential at $133 million (about 10,000 truckloads).
The EMEA region, which includes Europe, the Middle East, and Africa, is a vibrant market for pasta importers and related businesses. The market consists of a rich culinary tapestry spanning from the Mediterranean shores to the heart of Europe and the vast landscapes of Africa. Within this dynamic landscape, wholesalers, retailers, and food service providers play pivotal roles, catering to diverse tastes and preferences across various markets. The EMEA market showcases a broad spectrum of demand for pasta, from established distributors supplying pasta products to retailers and eateries to specialty stores offering curated selections to discerning consumers. Furthermore, importers specializing in sourcing pasta from around the world contribute to the market’s diversity, meeting the region’s varied culinary needs. Alongside these commercial entities, international aid organizations play a crucial role in providing pasta as part of humanitarian assistance efforts across the region. This exploration navigates through the complexities of the pasta import market in the EMEA region, highlighting the diverse array of players shaping its landscape and the multifaceted nature of pasta consumption in Europe, the Middle East, and Africa.
Unlocking New Markets: A GeoMap Exploration
In this sample GeoMap, we delve into target markets, meticulously mined and sorted based on the highest number of product categories traded within each corresponding region. Our search query focused on “pasta importers” and related organizations across Europe, the Middle East, and Africa (EMEA).
EMEA Pasta Target Market – Sample
However, the pandemic’s impact remains an enigma—how many businesses survived the COVID-19 disruption? This uncertainty underscores the need to adapt. It’s time to discard the old address book and embrace data extraction and analysis. The business landscape is undergoing unprecedented shifts, and survival hinges on our ability to unlearn and seek out new partners.
Remember: In this dynamic world, data-adaptability is the key to resilience.
request a password