

What is Data Analysis
Data analysis is an essential tool for businesses looking to explore global value chains for import-export opportunities. By leveraging data insights, businesses can grasp market trends, consumer behavior, and competitor strategies, enabling them to identify untapped markets, optimize supply chains, and make informed decisions about product development and pricing. Data analysis also allows businesses to track performance, identify areas for improvement, and adapt quickly to changing market conditions, ensuring competitiveness in today’s global economy.
Simple statistical methods such as aggregation and trend projections on UN Commodity data can help exporters discover potential target markets. Aggregation groups similar commodities, providing clarity on demand across regions, while trend analysis identifies emerging markets and declining product trends, assisting exporters in strategic decision-making. These methods offer valuable insights, enhancing export planning and decision-making processes effectively.
Development 350’s Data Lab transforms the complex global data landscape into straightforward charts categorized with HS (Harmonized System) Codes. These charts provide clarity on growing markets and opportunities, benefiting businesses and policymakers alike. By harnessing visualization and categorization, Development 350 provides clarity amidst complexity, empowering stakeholders to identify trends and make informed decisions. This approach facilitates the identification of burgeoning sectors and regions ripe for expansion, enabling users to navigate international trade confidently.
Focusing on key indicators such as export-import volume trends, market share analysis, and price trends, Development 350’s Data Lab offers actionable insights to support informed decision-making and drive business growth in the global marketplace.
The following G20 trade statistics summary highlights the significant economic impact of these nations. Despite representing 65% of the world’s population, G20 economies collectively contribute approximately 85% of the world’s total GDP, 78% of the world’s total exports, and 77% of the world’s total imports. These figures underscore the outsized economic impact and influence of the G20 economies on the global stage.
G20 Trade Summary
The G20 comprises 19 individual countries and the European Union, representing a significant portion of the global population, with approximately 5.3 billion people. This is in stark contrast to the G7, which consists of only seven nations and has a combined population of around 775 million.
Economically, the G20 outstrips the G7, generating a GDP of approximately $85 trillion compared to the G7’s $40 trillion. In terms of trade, the G20 dominates, contributing about 78% of the world’s total exports and representing around 77% of global imports. In contrast, the G7, while still influential, commands a smaller share of global exports and imports at around 46% and 43%, respectively.
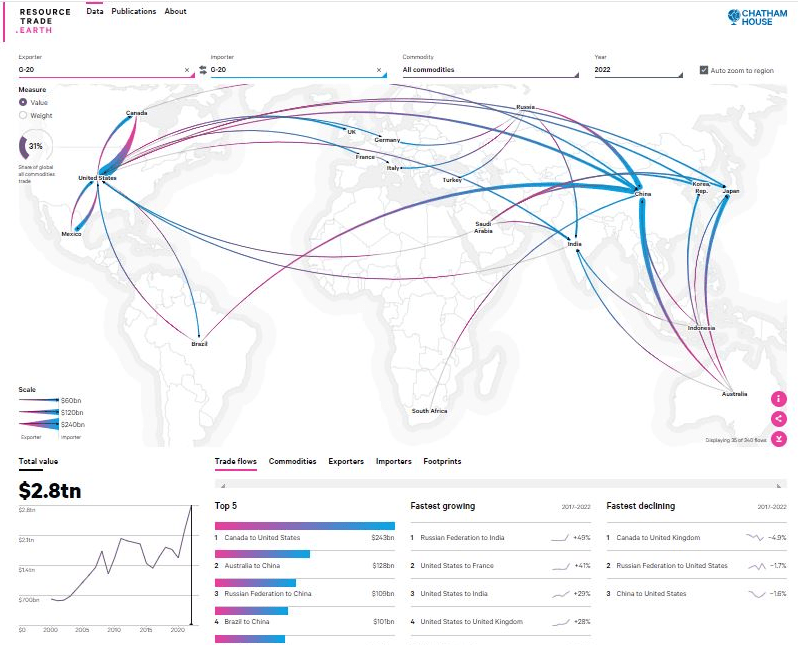
This comparison underscores the G20’s broader representation and economic influence on the global stage compared to the more exclusive G7. According to the United Nations, as of November 15, 2022, the world’s population has reached 8 billion. There are currently 195 countries in the world. However, the likelihood of any trade occurring beyond the G20 sphere is under 20%.
| Top 5 EXP By $ | Fastest Growing EXP 2017–22 | CMDTY Top 5 | Fastest Growing CMDTY 2017–22 | * Fastest Growing EXP 2012-22 | ** Fastest Growing IMP 2012-22 |
|---|---|---|---|---|---|
| Canada to US $243bn | nes to DE +2135% | Fossil Fuels $4.5tn | Fertilizers +19% | Vietnam $371bn +324% | Japan $900bn +98% |
| UAE to nes $221bn | Norway to DE +40% | Metals & Minerals $2.2tn | Fossil fuels +16% | Poland $360bn +191% | Australia $290bn +87% |
| Australia to CN $128bn | UAE to ,nes +31% | Agriculture $1.6tn | Metals & Minerals +8.9% | Ireland $208bn +182% | Brazil $270bn +86% |
| Russia to CN $109bn | Belgium to DE +30% | Forestry $219bn | Forestry +6.6% | China $3.7tn +175% | UK $816bn +84% |
| Brazil to CN $101bn | Australia to nes +30% | Pearls and Gemstones $157bn | Agriculture +5.7% | Türkiye $262bn +167% | HK,CN $670bn +83% |
** X >$200bn
Let’s consider a simple example. Around 50% of the world’s pasta imports were handled by select G20 members in 2022, highlighting the importance of key players in the market. Italy and Turkey together supply around 70% of the world’s pasta. Barilla is the top pasta brand worldwide, commanding a 34% share of the US market alone, while Walmart holds a significant 20% share of the US pasta market. Therefore, it’s plausible to suggest that both Barilla and Walmart together command a substantial share of the global pasta turnover.
Shifting away from market potential, the assessment of competitiveness can be simplified to price trend analysis. To illustrate, let’s revisit the pasta example.
The baseline import price of IRQ has consistently been lower than TRY’s global export price for pasta, which is $703/ton on average and $710/ton as a median. The top markets for pasta exports are the US, DE, and FR. Among these markets, the US has the largest untapped export potential, with additional exports valued at $417 million.
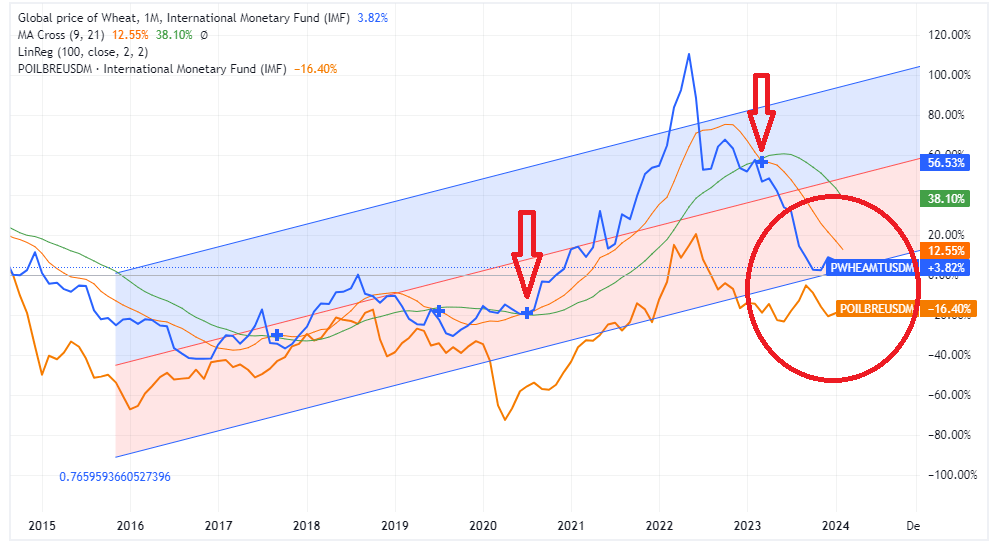
The chart depicted above illustrates the month-to-month fluctuations in Wheat prices per ton and Brent Crude prices per barrel throughout a ten-year period.
Several key points emerge:
- The occurrence of the MA Golden Cross on 2020/M7 and the MA Death Cross on 2023/M3 signify the conclusion of a bullish cycle for Wheat.
- A bounce-back in prices or a price rebound observed in 2024/M2 could indicate a potential bottoming out of Wheat prices, possibly signifying a reversal in trend.
- The positive correlation between Wheat and Brent prices ended abruptly by Q3 of 2023, signaling recession, thus less demand
Furthermore, By analyzing import data, we can conclude that FR, DE, and the US are promising export markets for Italian pasta exporters. FR has the most potential for additional exports worth $170 million (about 5000 truckloads). Turkey’s primary export markets are IRQ, the US, and SO (Somalia). IRQ has the most significant untapped potential at $133 million (about 10,000 truckloads).
The EMEA region, which includes Europe, the Middle East, and Africa, is a vibrant market for pasta importers and related businesses. The market consists of a rich culinary tapestry spanning from the Mediterranean shores to the heart of Europe and the vast landscapes of Africa. Within this dynamic landscape, wholesalers, retailers, and food service providers play pivotal roles, catering to diverse tastes and preferences across various markets. The EMEA market showcases a broad spectrum of demand for pasta, from established distributors supplying pasta products to retailers and eateries to specialty stores offering curated selections to discerning consumers. Furthermore, importers specializing in sourcing pasta from around the world contribute to the market’s diversity, meeting the region’s varied culinary needs. Alongside these commercial entities, international aid organizations play a crucial role in providing pasta as part of humanitarian assistance efforts across the region. This exploration navigates through the complexities of the pasta import market in the EMEA region, highlighting the diverse array of players shaping its landscape and the multifaceted nature of pasta consumption in Europe, the Middle East, and Africa.
Unlocking New Markets: A GeoMap Exploration
In this sample GeoMap, we delve into target markets, meticulously mined and sorted based on the highest number of product categories traded within each corresponding region. Our search query focused on “pasta importers” and related organizations across Europe, the Middle East, and Africa (EMEA).
EMEA Pasta Target Market – Sample
However, the pandemic’s impact remains an enigma—how many businesses survived the COVID-19 disruption? This uncertainty underscores the need to adapt. It’s time to discard the old address book and embrace data extraction and analysis. The business landscape is undergoing unprecedented shifts, and survival hinges on our ability to unlearn and seek out new partners.
Sample Pasta Market Report – Iraq 2025
The Iraqi pasta market, estimated at 200,000 to 250,000 tons annually and growing at 3-5%, is dominated by local brands like Al-Jehin (32% market share), Basateen (22%), and Nora (15%). Local pasta is priced lower at $800 to $1,000 per ton, while imports from Turkey, Iran, and Italy range from $1,000 to $1,600 per ton. Key market drivers include tariffs, currency fluctuations, and a preference for domestic products, with 60% of consumers choosing local. Future trends may see increased competition from Emirati and Chinese brands, potential tariff adjustments, and price hikes. For market entry, partnering with local distributors via social media, maps, or ads is recommended. Understanding that some markets may require non-traditional business approaches is crucial.

Top Iranian Spaghetti Brands in Iraq (Simplified Table)
| Brand | Manufacturer | Share of Iranian Imports | Avg. Price ($/ton) | Key Regions |
|---|---|---|---|---|
| Pars | Pars Industrial Group | ~45% | 950–1,100 | Baghdad, Basra |
| Sahand | Sahand Holding | ~25% | 900–1,050 | Najaf, Karbala |
| Daneh | Daneh Company | ~15% | 850–1,000 | Mosul, Sulaymaniyah |
| Kourosh | Kourosh Industrial Group | ~10% | 1,000–1,200 | Erbil, Duhok |
| Mahram | Mahram Company | ~5% | 1,100–1,300 | Luxury markets in Baghdad |
Key drivers for this market include tariffs, currency fluctuations, and a rising demand for instant and enriched pasta, with 60% of consumers preferring domestic products. Future trends indicate intensified competition from Emirati and Chinese brands, possible tariff adjustments, and potential price increases. For market entry, it would be best for you to partner with local distributors, which can be located through various OSINT tools such as DS CN AI, FB Grps, GMaps geolocations, or even OS Arabic ads. Recognizing that some markets may not fit traditional business approaches like formal presentations and exhibitions is essential. Iraqi food and FMCG markets peak during Ramadan, Muharram, and mid-August for the school year.
Understanding Forex Competitiveness, Seasonality, and Competition Illustrated Through Simple Charts HS190531- Biscuits


The four charts clearly illustrate a significant increase in TR/IQ exports, particularly for products targeted at the under-14 age group, which greatly surpasses demand during the Ramadan season as the new school year begins. They also demonstrate how much more advanced these exports are compared to neighboring competitors in this market. According to Indexbox, Iraq’s sweet biscuit market is predominantly driven by imports, accounting for an impressive 53% of total Middle East imports by value in 2024, with Turkey being the leading supplier. While a specific overall market share for Iraq is not provided, it is acknowledged as a major import market, representing 77% of the region’s total sweet biscuit imports by quantity in 2024. Turkey’s baby food formula exports to Syria in 2025 are also seeing a fivefold increase due to recent positive geopolitical developments similar to those in Iraq.
Journey to the Heart of the Matter!
Sample Data/ Spaghetti Distributors – Iraq
| Company Name | Arabic Name | Contact Number | Website / Email |
|---|---|---|---|
| Al-Rafidain Pasta Trading | التجارة الرافدين للمعكرونة | +964 770 123 xxxx | www.rafidain-pasta.iq |
| Baghdad Spaghetti Distributors | موزعو معكرونة بغداد | +964 771 234 xxxx | [email protected] |
| Al-Mashriq Food Industries | صناعات المشرق الغذائية | +964 772 345 xxxx | www.mashriq-food.com |
| Al-Zahraa Pasta Co. | شركة الزهراء للمعكرونة | +964 773 456 xxxx | [email protected] |
| United Noodles Iraq | المتحدة للمعكرونة العراق | +964 774 567 xxxx | www.united-noodles.iq |
| Al-Safa Spaghetti Trading | تجارة الصفا للمعكرونة | +964 775 678 xxxx | [email protected] |
| Al-Qadisiyah Pasta Importers | واردون القادسية للمعكرونة | +964 776 789 xxxx | www.qadisiyah-pasta.com |
| Al-Nahrain Food Products | منتجات النهرين الغذائية | +964 777 890 xxxx | [email protected] |
| Al-Mansour Pasta Distributors | موزعو المنصور للمعكرونة | +964 778 901 xxxx | www.mansour-pasta.iq |
| Al-Furat Spaghetti Co. | شركة الفرات للمعكرونة | +964 779 012 xxxx | [email protected] |
The Premier Annual Food Exhibitions Worldwide
| Event Name | Location | Frequency | Focus / Highlights | Website |
|---|---|---|---|---|
| SIAL Paris | Paris, France | Every 2 years | Global food innovation, launches & trends | sialparis.com |
| Anuga | Cologne, Germany | Every 2 years | World’s largest F&B fair – 10 themed | anuga.com |
| Cibus | Parma, Italy | Annually | Italian food, Mediterranean diet, exports | cibus.it |
| Gulfood | Dubai, UAE | Annually (Feb) | Middle East’s largest F&B trade show | gulfood.com |
| Fancy Food Show | USA (NY & SF) | Twice a year | Gourmet, organic, specialty & artisan foods | specialtyfood.com |
| FOODEX Japan | Tokyo, Japan | Annually (March) | Asia’s largest F&B exhibition | foodex-japan.jp |
| Thaifex – Anuga Asia | Bangkok, Thailand | Annually (May/June) | Asian innovation, co-hosted with Anuga | thaifex-anuga.com |
Sample EMM Report
Much like FB’s Discussion Groups, Email mass marketing (EMM) is a powerful tool for B2B communication, allowing companies to send a single email to a large audience to promote products, share updates, or nurture leads. Its effectiveness is tracked using metrics like open rates, click-through rates, and conversion rates. EMM facilitates direct communication with decision-makers, helping to generate leads and build relationships effectively.
Data Processed As Is …

Same Data Processed and Verified With AI

TMSEEK, developed by Development350.com and based on TMAP V4, is a Windows program that automates the discovery and validation of company contacts from CSV files using the TMO B2B dataset. It can find missing websites, scrape contact details, verify them with AI, and gather domain information while ensuring reliability through continuous saving and rate limiting. Users must accept a legal disclaimer regarding compliance with laws like the CFAA, GDPR, and CAN-SPAM before use. Results are processed and saved in an output CSV sorted by turnover, making TMSEEK an effective lead-generation tool.
request the program with instructions here


A Reverse Approach: Diversification
Sometimes, taking a reverse approach, such as analyzing growth potential through global value chain data, can simplify the process of selecting the right venture. This method can be more effective than choosing a product first and then finding markets for it, as illustrated in the following chart.


2nd Example: VN’s Agri-Export 2024–2025 Outlook
VN continues to strengthen its position in global agri-exports, with two HS categories leading the way:
- HS081060: Exports exceeded $3B, with over 90% going to CN. Smaller but steady flows reach TW, HK, and JP, while EU demand remains limited.
- HS080132: Another ~$3B category, with robust global demand. Top destinations are US, CN, and EU. A recent AI-validated dataset highlighted 6,084 NL importers, including 3,341 URLs and 1,486 double-checked contacts, opening the door to highly targeted outreach.
How the Data Was Processed
Using a Python TMSEEK AI program, the dataset was scanned and validated over 24 hours, producing:
- Raw Data – 6,084 NL importers, 3,341 URLs.
- AI Verified Data – 4,774 URLs and 2,000+ contacts.
- Valid List – 1,486 validated for reliable outreach.

Market Approach
The current offer (2025-M05) stands at $7.34/kg + CIF $2000 per 40ft / IMP TAX %0. Campaigns can be launched via Gmail/EME, with intros focused on solving the buyer’s needs first. Having a backup HS code offer increases the chance of conversion. Research support is available through Vietnam Customs, industry-specific FB groups, and reverse-engineering Dutch retail shelves.
NL: The Gateway to Europe
With ~28% of Vietnam’s agri exports to the EU passing through NL, the country acts as a powerful gateway to both European and North American markets. Key wholesale hubs include:
- Fresh Food Amsterdam
- TFC Holland
- FruitMarket
- Olympic Fruit
- Fresh Wise
- Agrifoods
Strategic Outlook
- While both HS081060 and HS080132 are ~$3B export categories, long-term gains come from value-added processing (extracts, jams, small packing, labeling).
- Positioning NL as the entry point helps cover some of the EU market and beyond.
- For startups/SMEs: start lean, avoid mass outreach, and build momentum with credibility-driven campaigns.
Final Thoughts
Geopolitics is important, but markets can shift quickly. Look for a partner who identifies trends and top performers. For instance, in five years, Australia and China are expected to outpace Pakistan and India in potassium sulfate imports from Taiwan, with opportunities emerging in the UAE, South Africa, and Thailand. We use XGBoost for trade pricing and volume due to its ability to detect complex patterns in historical data while preventing overfitting. It also handles missing or noisy data well, resulting in reliable predictions. Initially, our analysis endpoint was set to 2024, but upon reviewing data for 2025, we found that Australia has already secured second place!
Here is the catch: Do B2B listings get updated as quickly as markets shift and change? Here’s what the real numbers show:
- In Germany, corporate insolvencies rose to 21,964 in 2024, up ~23.1% from 17,847 in 2023. (CRIF)
- Across Europe, corporate insolvencies in 2024 hit 190,449, up ~12.2% from 169,792 in 2023. (FBIS)
- In the US, bankruptcy filings among businesses surged, reaching the highest number of large bankruptcies since 2010—with at least 686 major firms in 2024, and overall business insolvencies up ~22%. (Financial Times)
- In Australia, business insolvency appointments increased ~50% in the six months ending December 2024 (7,483) vs same period prior year (~5,088), with projections of up to 16,000 total insolvencies for the fiscal year. (The Australian)
The gap between business directories that label many firms as “valid” and the reality of numerous businesses failing is a significant issue—it’s not just conspiracy talk. Delays in support during COVID-19 and rising borrowing costs, particularly due to interest rate hikes, have caused many companies to remain listed long after they have ceased operations. As discussed by Klaus Schwab, the “Great Reset-2025” narrative reflects these observable trends in global business decline, indicating that perhaps one in five of your former contacts may no longer be active.
In our dynamic world, data adaptability fuels resilience. Let go of the old phonebook and embrace new learning!